Coastal Inundations
Comparison of two recent coastal inundation events at Wellington South Coast…
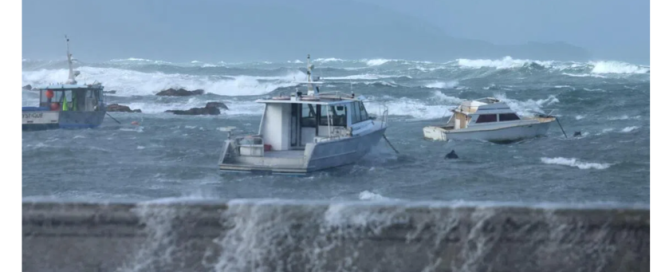
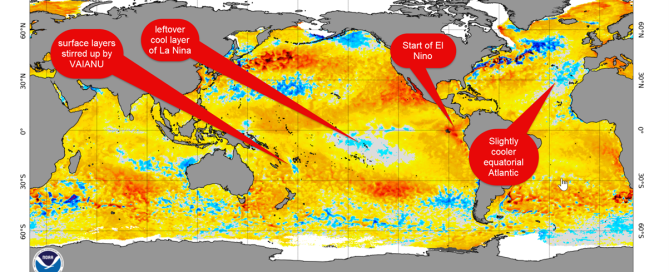
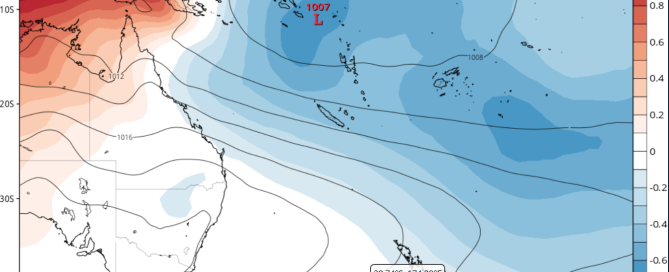
Tuesday 9 June 2026 brought huge swells that inundated Wellington’s south coast.


MetBob. Bob McDavitt is the weather guru that uses //etBoB to provide meteorological information for cruising sailors, primarily for those in the South Pacific.

The Isobar reading was 1008.
Compare that with the 15-16 Feb 2026 coastal inundation weather pattern.


On that date, the isobar reading was around 998.
I think it is the same seawall in both images.
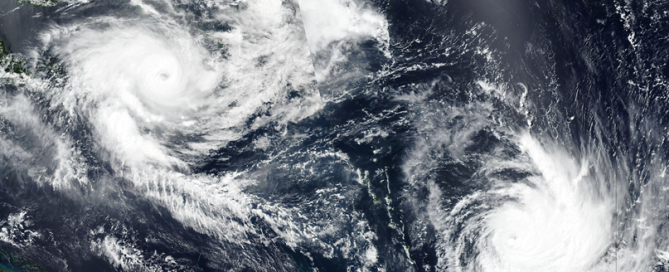
One of the factors we consider during coastal inundations is the “IB” or inverse barometric /inverted Barometer effect.
Average atmospheric pressure at sea level on this planet is 1013.35hPa, hence 1012hPa is always the straightest isobar on the weather map and divides high pressure weather from low pressure weather.
- Every hPa above that depresses sea level by 1cm
- Every hPa below that raises sea level by 1cm
For more information about coastal inundation, read the following post I wrote for MetService back in 2011: blog.metservice.com/Storm-Surge-23-Jan-2011
Bob McDavitt


