Introducing RONI

A more indicative measure of ENSO…Introducing  RONI

ENSO stands for El Nino- Southern Oscillation

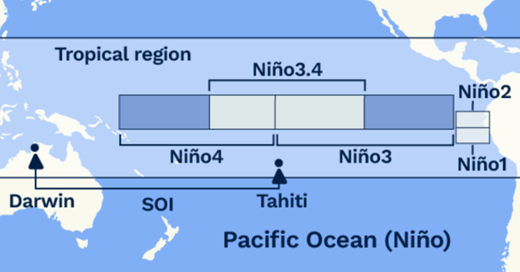
The EN part of this parameter deals with sea temperature. We have been using the sea surface temperature measured in the Nino3-4 area as the parameter for deciding if the atmosphere is being driven by El Nino or La Nino or is in between the two in neutral gear.

The SO part deals with the isobaric pressure difference between Darwin and Tahiti… located on this map:

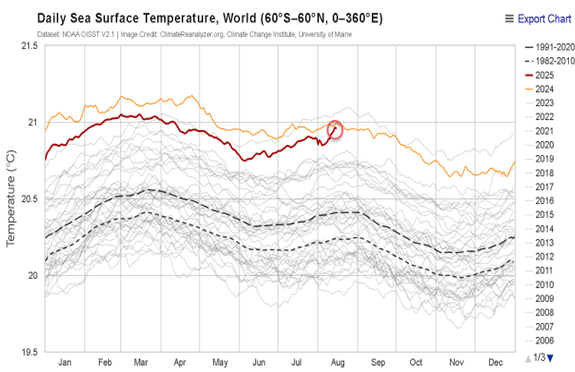
From climatereanalyzer.org/clim/sst_daily/
Bob McDavitt

MetBob. Bob McDavitt is the weather guru that uses //etBoB to provide meteorological information for cruising sailors, primarily for those in the South Pacific.

However, climate change has been raising the world’s average sea temperate in a roller-coaster fashion

From www.moanaproject.org/marine-heatwave-forecast

o try and remove this trend from the measurements, climatologists in Australia and NZ have introduced a new measure called the RELATIVE OCEANIC NINO INDICIES (RONI).

As seen at https://www.bom.gov.au/climate/enso/ 

Relative Oceanic Niño indices RONI

RONI measures sea surface temperature anomalies in the Niño regions but mathematically removes any long-term trend found in the tropical region temperature. This helps relate the value more closely to localised processes associated with ENSO, rather than larger-scale tropical SST features such as global warming.

RONI values are scaled to have the same variance as the traditional index. Anything more than 0.8C above normal is in El Niño territory, and anything less than -0.8 is in La Niña territory.  This is what REL NINO 3-4 looks like from April 2021to Sep 2025.

It gives a good view of the El Nino in late 23/early 24 and the La Nina of late 24/early 25 and shows a neutral trend in recent data.

The RONI is forecast to have a 55% chance of getting into La Niña territory by the end of the year.  It is close to a coin toss, and if it comes down as La Niña then this summer in Northland may be like last summer.

2025-09-26T02:58:47+12:0026 September 2025|Weather|

Are the Oceans now struggling?

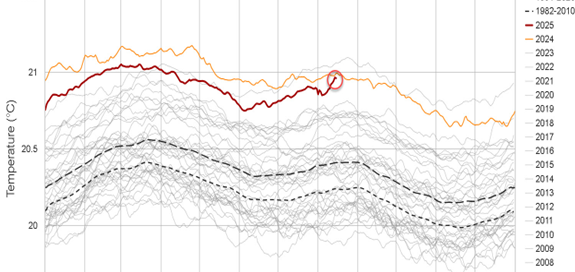
Are the Oceans now struggling to store extra earth heating? Since July 2023 it is as if the global averaged sea temperature has jumped into a new regime with less erraticism in the signal. We still cannot tell if this is a fundamental change that may adversely energise further weather events.  And yet in the first half of August there has been an erratic and rather extreme rise in daily global SST. I wish we knew the reasons for this.

From climatereanalyzer.org/clim/sst_daily/
Bob McDavitt

MetBob. Bob McDavitt is the weather guru that uses //etBoB to provide meteorological information for cruising sailors, primarily for those in the South Pacific.

Until now, 90 per cent of the excess heat created by greenhouse gas emissions has been drawn down into the ocean. Under this new regime, it seems that this capacity for heat absorption is being lost. SO, where will the extra heat now get stored?

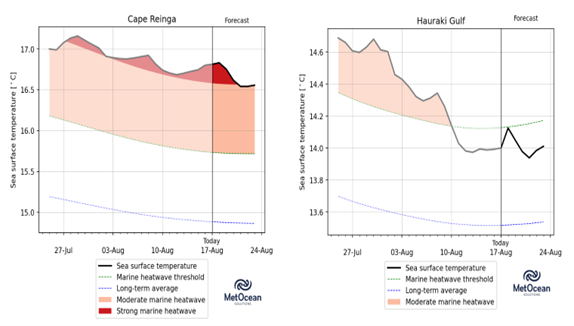
The Cape Reinga region over Far North New Zealand is having a winter heatwave. However, Hauraki Gulf is just slightly above normal.

From www.moanaproject.org/marine-heatwave-forecast

The rain accumulation for the year to date shows that it has been wetter than normal in northern NZ — with the “wetter” kicking in around 21 April, and % excess much more in Auckland than around Kerikeri.

While local variations remain — such as heatwaves in the Far North alongside only modest anomalies in the Hauraki Gulf — the broader picture is one of rising unpredictability. Understanding whether this is a temporary fluctuation or a lasting change will be critical, as it may determine how both our oceans and our communities absorb the pressures of a warming world.

2025-08-28T00:14:52+12:0020 August 2025|Weather|

When to Go Left

When to Go Left (in the Southern Hemisphere)

Last month we looked at “the law of storms”. Basically, this can be summarised that the way to go, to evade the roughest weather in a depression,  is to the right of the incoming wind.

However, when your voyage involves encountering a passing trough or frontal zone then the best thing to do is to go left and sail directly into the approaching rain. By so doing we MINIMISE the time spent in the peak conditions of the trough. This is a case where the way to go is on a starboard tack, the opposite to the law of storms

Bob McDavitt

MetBob. Bob McDavitt is the weather guru that uses /\/\etBoB to provide meteorological information for cruising sailors, primarily for those in the South Pacific.

1: In the case above we intend to sail to the north but have an incoming trough approaching from the west.  The barometer is falling and “law of storms” suggest we go east.  But in this case the better direction to go is to the left in steps, first to NW. then to W and maybe to SW.

Decode

Along path: Red barbs and arrows show forecast winds and current-one barb is 10 knots and half is 5, add 40-50% to get gusts. At map time: Black lines are isobars; streamlines are average winds. Purple arrow/shading are mean wave height/ direction. Blue/ Green//Red shading for rain. Black arrows show the currents.

2: Above, around 22hours later, position circled.

As the wind increased, we turned more to the left, to the west.  Soon we will be captured by the rainy part of the front and maybe in NW or westerly winds. In these we turn more to the left going to the SW — a dogleg.

3:  Above, around 14 hours later.

When the rain stops and the backing wind is from WSW, near position circled – yippee–we have got to the other side of the passing trough and we can resume our trip northwards with wind on port (as prescribed by the “law of storms”).

Bob McDavitt – check my other blogs at www.metbob.com

2025-07-19T03:39:52+12:0017 July 2025|Weather|
Go to Top