The Season of mist and mellow

April brings a mix of warm days and cooler earlier evenings, a reminder that autumn is now with us. Easter and its attached school holidays bring to many of us the last chance for enjoying a good sail before the shorter days of winter sets in.

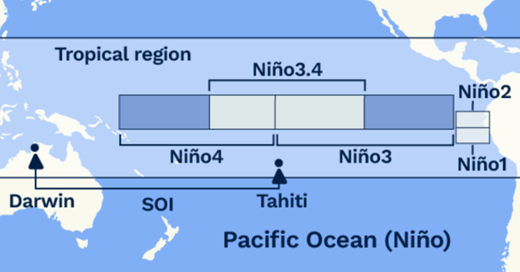
The internet is abuzz with several commentators reporting that there may be a switch to an extreme El Nino later this year. For now, relax. Indications are that, during April and into May, the Tasman Sea /New Zealand area weather is likely to be close to normal.

Our friends at tropical tidbits.com mainly watch tropical cyclones. They also give access to some climate models which show outlooks for the month of April based on current trends.

These are called anomalies and they indicate how this April may vary from normal.

Bob McDavitt

MetBob. Bob McDavitt is the weather guru that uses //etBoB to provide meteorological information for cruising sailors, primarily for those in the South Pacific.

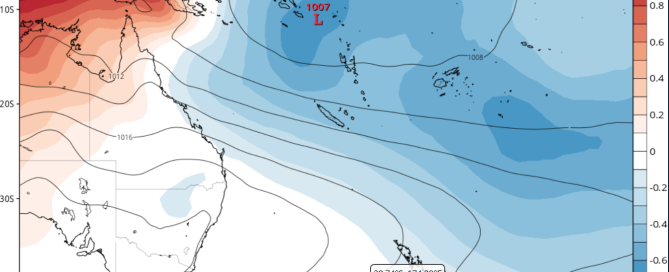
In this map the isobars show the averaged weather forecast for April. Note how in April, on average, the west-southwest winds of winter reach as far north ad Cook strait, and a High centred near the Australian Bight noses a ridge of relatively light winds onto the Bay of Islands. Daily weather pattern shuffle around this idea.

The shading shows expected difference from a normal April. The red and brown areas over Papua New Guinea are above normal — but only by small amounts. And the blue shadings between Solomons and Tonga are below normal. Note that these are over a low-pressure area (the South Pacific convergence zone) and so this is expected to be accentuated in April.

This blue shading extends as far south as the Bay of Islands but there it is rather weak. The isobars indicate average winds over Bay of Islands in April are light southwest winds, and the anomalies suggest a possible swing towards southeast winds, so the result may be southerly winds…a dry direction.

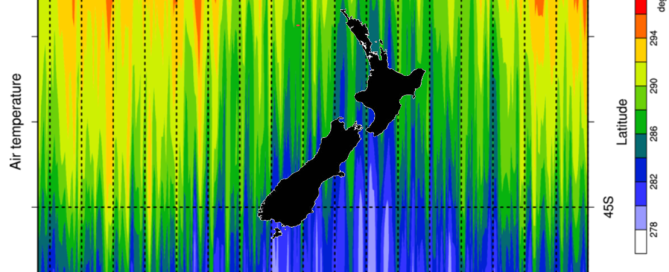
Indeed, when we look at the forecast rain anomalies for April, the Bay of islands anomalies are negative/yellow.

This doesn’t mean that there will be negative rain, but that the rain we get is expected to be less than normal ion April. The brown and red shades over New Guina highlands are pointing to extremely dry condition there. The green and blue shading in the Solomon Islands and Tonga are suggesting an accentuated South Pacific convergence zone.

This time of year brings the chance for beautifully calm mornings, ideal for fishing or a gentle cruise to one of the many idyllic anchorages around the Bay. Watching a sunrise or sunset in autumn over calm seas is a reward in itself.

Bob McDavitt

2026-03-17T13:55:37+13:0015 March 2026|Weather|

Summer in review

It has been a disastrous summer in New Zealand – but not-so-bad in the Bay of Islands.

Kerikeri airport data below shows cold wet and windy snaps highlighted with circles. These appeared especially mid-December and between Christmas and New Year, followed by a heat wave on 9 and 10 Jan. The main weather event was the approaching trough on 18 to 20 Jan.

Bob McDavitt

MetBob. Bob McDavitt is the weather guru that uses //etBoB to provide meteorological information for cruising sailors, primarily for those in the South Pacific.

The next image shows the daily averaged isobars over the NZ area for the main part of summer (longitudes 160E to 180 and latitudes 25S to 50S from Dec 1st to Feb 10th). The passing HIGHS usually pace themselves at around once a week with a trough in-between, but that New year trough and 18-26 Jan trough stand out as bucking the pattern.

There has been a dominant HIGH east of New Zealand, and it has been directing troughs from the Tonga region south-westwards to eastern parts of NZ, with damaging consequences especially between Christmas and New Year, at Mount Maunganui on 22 Jan, in Wellington on 4 Feb, and then again on 16 and 17 Feb (not shown above). The troughs have been exacerbated by a marine heat wave.

The storm on 16Feb had a weather map very similar to a storm 22 years ago on 15Feb 2004 (which damaged Manawatu):

The outlook for autumn is for a return to “normal”, allowing what I call the “Weather Jazz” pattern in which each player gets to go solo for a spell.

Bob McDavitt

2026-02-20T16:31:06+13:0020 February 2026|Weather|

Last year’s weather

Here is a time-latitude plot of the air temperature measured over a north-south slice of Aotearoa/ NZ as it travelled through 2025.

Bob McDavitt

MetBob. Bob McDavitt is the weather guru that uses //etBoB to provide meteorological information for cruising sailors, primarily for those in the South Pacific.

The land silhouette is provided to help relate the latitude axis to your place. It clearly shows temperature is cooler further south and during winter. This time section makes a “bar-code” graph which reveals the annual trend and the daily variation.  It gives a rough indication of the extremes and provides a visual image for quick comparison with any another year to see seasonal variations.

Here below is what we had in 2024. Compared with 2024, 2025 was cooler with some blue getting to the far north in winter.

Looking at a similar diagram for the barometric air pressure provides a graph that combines all the daily weather maps into one image. This produces a more random looking barcode. The yellow and red lines correspond to passing HIGHS on the weather map, and the blues show the LOWS or depressions/storms. The scale is in Pascals, divide this by 100 to get hectoPascals/millibar.

This has more red in it than last year, with the months from April to August being mostly marked with passing Highs on the weather map.

The rain image below is probably the most interesting as it highlights the dry periods in Northland last February to April, wetness from May to October and dry from October to mid-December, then a wet Christmas/New year.

2026-01-15T13:48:12+13:008 January 2026|Weather|

Happy Holidays

This summer we are forecasting weak LA NINA conditions and these help keep the HIGH pressure systems as seen on the weather map over central New Zealand, so that mainly maintains easterly winds over the Bay of Islands. It also keeps the “northern door” open to tropical lows that form near Fiji or Tonga to travel towards Northland.   The warmer than normal seas that are now covering the Tasman and Coral Seas will allows weather systems to bring more rain when they can.

Bob McDavitt

MetBob. Bob McDavitt is the weather guru that uses //etBoB to provide meteorological information for cruising sailors, primarily for those in the South Pacific.

Mid December marine heat waves as seen at https://www.moanaproject.org/marine-heatwave-forecast

Weatheronline is a UK website that gives spot readouts from a seasonal weather model.  This gives the weather forecast (wind, rain, temperature, and pressure).  It is unlikely that such a model can capture the exact timing or intensity of extreme events, but there may be some value in the peaks and troughs so I am showing them here for educational purposes only …please check the latest forecast before embarking on anything sensitive.

The barometric pressure forecast shows a good probability of a passing low on 9 January and a smaller probability of one around 1 January.

The wind forecast shows the possibility of stronger winds around 8 January and 5 February.

2025-12-14T02:10:31+13:0014 December 2025|Weather|

Lightning

Marine forecasts give a situation statement that lists the location and movement of features seen on weather maps… Highs, Lows, Convergence zones and fronts. They give warnings of areas with gales or stronger, heavy swells, and freezing conditions.

But they don’t mention or give warnings about lightning.

If you have access to the Internet and websites, then windy.com and Predictwind.com do include lightning maps.

The Predictwind map combines lightning and satellite imagery with the GMDSS (Global Maritime Distress and Safety System) warning and situation maps.

From forecast.predictwind.com/satellite-imagery

Bob McDavitt

MetBob. Bob McDavitt is the weather guru that uses //etBoB to provide meteorological information for cruising sailors, primarily for those in the South Pacific.

Turn lightning on in the map options

Windy.com offers several global models and displays wind, isobars, rain and lightning on the same map along with observations.

For people visiting the cruising grounds of New Zealand Weatherwatch has compiled a special page for lightning weatherwatch.co.nz/maps-radars/lightning/thunderstorm-risk

This can be a useful place to check before sailing.

2025-11-14T00:53:51+13:0014 November 2025|Weather|

Why so windy this spring?

Why so windy this spring?

Bay of Islands wind and barometer over past month…..

From climatereanalyzer.org/clim/sst_daily/

There has been a SSW (sudden stratospheric warming) in Antarctica. The following notes are from www.weatherzone.com.au/news

The polar vortex extends from the surface up to the stratosphere. The stratospheric polar vortex sits about 10 to 50 km above Earth’s surface and over the pole. This section of the polar vortex is strong and typically shaped like a circle or oval. Beneath it lies the tropospheric polar vortex which affects weather patterns by changing the shape and behaviour of the polar jet stream.

Bob McDavitt

MetBob. Bob McDavitt is the weather guru that uses //etBoB to provide meteorological information for cruising sailors, primarily for those in the South Pacific.

Sudden stratospheric warming

A Sudden Stratospheric Warming (SSW) is a rapid increase in temperature in the polar stratosphere triggered by sinking air. These stratospheric warming episodes can filter downwards through the atmosphere, weaken the polar vortex and allow disturbed westerly winds to spread equator-wards.

The recent SSW is shown in the video below:

This weakened the polar vortex to weaken, allowing the polar jet stream to drag cold air away from Antarctica, and bringing more westerly winds than normal to New Zealand.  This can be measured by negative values of the Southern Annular Mode (SAM), I use the AAO (Antarctic Oscillation) as a proxy for SAM and indeed the forecasts in red below are showing it may well be negative next few weeks:

This would make the following conditions more likely in

  • More westerly winds= wet over the Southern Alps, hot and dry for Canterbury plains. Squally for Bay of Islands.

So that explains our recent dramatic weather.

2025-10-11T03:45:31+13:0011 October 2025|Weather|

Introducing RONI

A more indicative measure of ENSO…Introducing  RONI

ENSO stands for El Nino- Southern Oscillation

The EN part of this parameter deals with sea temperature. We have been using the sea surface temperature measured in the Nino3-4 area as the parameter for deciding if the atmosphere is being driven by El Nino or La Nino or is in between the two in neutral gear.

The SO part deals with the isobaric pressure difference between Darwin and Tahiti… located on this map:

From climatereanalyzer.org/clim/sst_daily/
Bob McDavitt

MetBob. Bob McDavitt is the weather guru that uses //etBoB to provide meteorological information for cruising sailors, primarily for those in the South Pacific.

However, climate change has been raising the world’s average sea temperate in a roller-coaster fashion

From www.moanaproject.org/marine-heatwave-forecast

o try and remove this trend from the measurements, climatologists in Australia and NZ have introduced a new measure called the RELATIVE OCEANIC NINO INDICIES (RONI).

As seen at https://www.bom.gov.au/climate/enso/ 

Relative Oceanic Niño indices RONI

RONI measures sea surface temperature anomalies in the Niño regions but mathematically removes any long-term trend found in the tropical region temperature. This helps relate the value more closely to localised processes associated with ENSO, rather than larger-scale tropical SST features such as global warming.

RONI values are scaled to have the same variance as the traditional index. Anything more than 0.8C above normal is in El Niño territory, and anything less than -0.8 is in La Niña territory.  This is what REL NINO 3-4 looks like from April 2021to Sep 2025.

It gives a good view of the El Nino in late 23/early 24 and the La Nina of late 24/early 25 and shows a neutral trend in recent data.

The RONI is forecast to have a 55% chance of getting into La Niña territory by the end of the year.  It is close to a coin toss, and if it comes down as La Niña then this summer in Northland may be like last summer.

2025-09-26T02:58:47+12:0026 September 2025|Weather|

Are the Oceans now struggling?

Are the Oceans now struggling to store extra earth heating? Since July 2023 it is as if the global averaged sea temperature has jumped into a new regime with less erraticism in the signal. We still cannot tell if this is a fundamental change that may adversely energise further weather events.  And yet in the first half of August there has been an erratic and rather extreme rise in daily global SST. I wish we knew the reasons for this.

From climatereanalyzer.org/clim/sst_daily/
Bob McDavitt

MetBob. Bob McDavitt is the weather guru that uses //etBoB to provide meteorological information for cruising sailors, primarily for those in the South Pacific.

Until now, 90 per cent of the excess heat created by greenhouse gas emissions has been drawn down into the ocean. Under this new regime, it seems that this capacity for heat absorption is being lost. SO, where will the extra heat now get stored?

The Cape Reinga region over Far North New Zealand is having a winter heatwave. However, Hauraki Gulf is just slightly above normal.

From www.moanaproject.org/marine-heatwave-forecast

The rain accumulation for the year to date shows that it has been wetter than normal in northern NZ — with the “wetter” kicking in around 21 April, and % excess much more in Auckland than around Kerikeri.

While local variations remain — such as heatwaves in the Far North alongside only modest anomalies in the Hauraki Gulf — the broader picture is one of rising unpredictability. Understanding whether this is a temporary fluctuation or a lasting change will be critical, as it may determine how both our oceans and our communities absorb the pressures of a warming world.

2025-08-28T00:14:52+12:0020 August 2025|Weather|

When to Go Left

When to Go Left (in the Southern Hemisphere)

Last month we looked at “the law of storms”. Basically, this can be summarised that the way to go, to evade the roughest weather in a depression,  is to the right of the incoming wind.

However, when your voyage involves encountering a passing trough or frontal zone then the best thing to do is to go left and sail directly into the approaching rain. By so doing we MINIMISE the time spent in the peak conditions of the trough. This is a case where the way to go is on a starboard tack, the opposite to the law of storms

Bob McDavitt

MetBob. Bob McDavitt is the weather guru that uses /\/\etBoB to provide meteorological information for cruising sailors, primarily for those in the South Pacific.

1: In the case above we intend to sail to the north but have an incoming trough approaching from the west.  The barometer is falling and “law of storms” suggest we go east.  But in this case the better direction to go is to the left in steps, first to NW. then to W and maybe to SW.

Decode

Along path: Red barbs and arrows show forecast winds and current-one barb is 10 knots and half is 5, add 40-50% to get gusts. At map time: Black lines are isobars; streamlines are average winds. Purple arrow/shading are mean wave height/ direction. Blue/ Green//Red shading for rain. Black arrows show the currents.

2: Above, around 22hours later, position circled.

As the wind increased, we turned more to the left, to the west.  Soon we will be captured by the rainy part of the front and maybe in NW or westerly winds. In these we turn more to the left going to the SW — a dogleg.

3:  Above, around 14 hours later.

When the rain stops and the backing wind is from WSW, near position circled – yippee–we have got to the other side of the passing trough and we can resume our trip northwards with wind on port (as prescribed by the “law of storms”).

Bob McDavitt – check my other blogs at www.metbob.com

2025-07-19T03:39:52+12:0017 July 2025|Weather|
Go to Top