



YES the oceans are breaking records!

MetBob. Bob McDavitt is the weather guru that uses //etBoB to provide meteorological information for cruising sailors, primarily for those in the South Pacific.
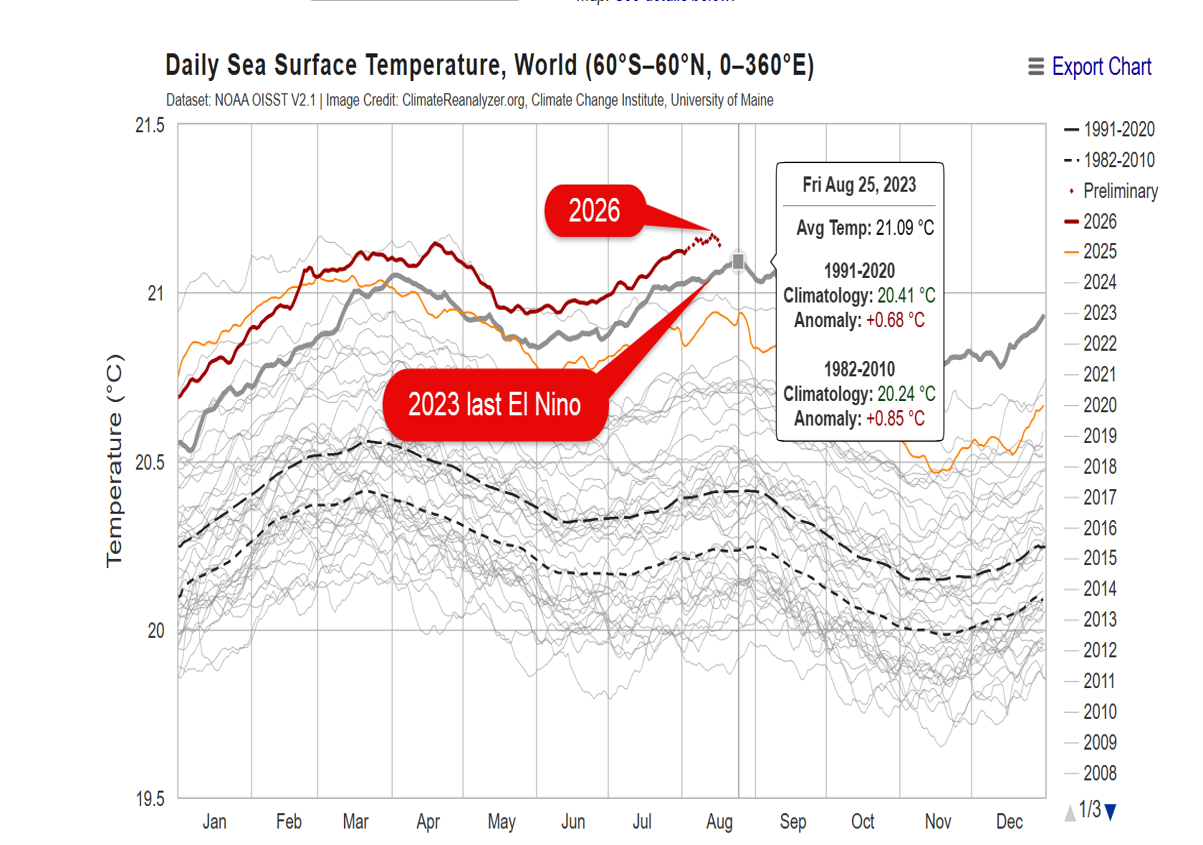
This diagram, sourced from https://climatereanalyzer.org/clim/sst_daily/, provides a time-series view of daily mean sea-surface temperature (SST) using NOAA’s Optimum Interpolation SST (OISST) version 2.1 dataset. It offers a useful snapshot of how ocean temperatures are changing over time and helps place present conditions in a longer-term context.
OISST is a global, gridded dataset with a spatial resolution of 0.25° by 0.25°. Its temperature estimates blend observations from satellites, ships and ocean buoys, helping to provide consistent coverage across areas where direct measurements may be sparse. The dataset begins on 1 September 1981 and extends to the present, usually with a delay of one or two days. The most recent two weeks of data are preliminary until NOAA posts the finalised product. Daily values should therefore be treated as estimates, and any apparent record high or low in OISST should be checked against other datasets before firm conclusions are drawn.
The diagram indicates that the average temperature of the world’s oceans is now about 1°C above the long-term normal and roughly half a degree warmer than in 2023, the previous recent El Niño year. This matters because oceans store enormous amounts of heat and release it gradually into the atmosphere. Warmer seas can influence rainfall, wind patterns, humidity and the energy available to developing weather systems. El Niño is not the only factor affecting global ocean warmth, but it can reinforce unusual temperature patterns across the tropical Pacific and alter atmospheric circulation well beyond the tropics.
For New Zealand, the spring outlook suggests a period of variable and sometimes vigorous weather. A strong El Niño often favours more frequent westerly or southwesterly airflows. Several active fronts may cross the country, followed by gusty west-to-southwest winds and bursts of heavy southerly swell. These conditions can create challenging periods for coastal communities, marine activities, transport and exposed farming areas. Rainfall may be higher than normal in the west and southwest, where moist air is lifted over the ranges, while the north and east may experience drier-than-normal conditions because they sit in the lee of the main mountain chains.
However, El Niño does not determine the weather on every day or in every location. Individual storms, local sea temperatures and shorter-term climate patterns can still produce significant departures from the seasonal outlook. A drier regional forecast, for example, does not rule out isolated heavy rain, just as a wetter outlook does not mean continuous rainfall. Communities should therefore use the outlook as a guide to increased likelihood rather than as a fixed prediction.
The practical message is that unusually warm oceans deserve close attention. Farmers may need to plan for uneven rainfall, water demand and wind exposure; coastal users should monitor swell forecasts; and households should stay alert to rapidly changing conditions. The Climate Reanalyzer graphic is valuable because it makes the broad trend visible, but it is best interpreted alongside official forecasts and other independent climate datasets. Taken together, these sources point to a spring shaped by elevated ocean heat, a strong El Niño influence and a greater chance of sharp contrasts between wetter western areas and drier northern and eastern districts.
Basically, because the ocean is breaking temperature records, we are moving into some weather patterns which we have not seen before, and so should take extra care to monitor the daily weather forecasts before sailing this spring.
Bob McDavitt